
I have a Linux NAS that I use to back up various things around the house. One day, I was unable to log into it via SSH. After I attempted a manual restart, I was still unable to log in. So, I had to drag a mouse, keyboard and monitor out of the closet to determine what was wrong. Turns out I had filled the small primary filesystem while saving bad sector data for a drive that had failed in the RAID array. A quick delete of the analytics data and I was back in business. However, I didn't want to repeat this every time I had a problem on the system. So, I looked into full screen Linux monitoring dashboards.
The first dashboard I tested was linux-dash. It is simple to install, has a clean layout, a few themes and is very easy to modify. Unfortunately it did not work out of the box against my Debian system, so I created a fork and fixed the issues I encountered on my system.
I also tested netdata which is the most complete dashboard on this list. It installs with no issues, has a number of available themes, a huge set of configurable monitors, and plenty of active demos. I did find it's default layout a bit busy, and I wasn't able to get everything I wanted onto a single screen.
I ran a demo of linux-dash and netdata for some coworkers and was disappointed when they both performed very poorly on my C.H.I.P.. The C.H.I.P. does have limited resources but both dashboards loaded the system to the point that it was nearly unusable. I was concerned that the overhead of the dashboard server, a windowing system, and a browser were too high for a slower system.
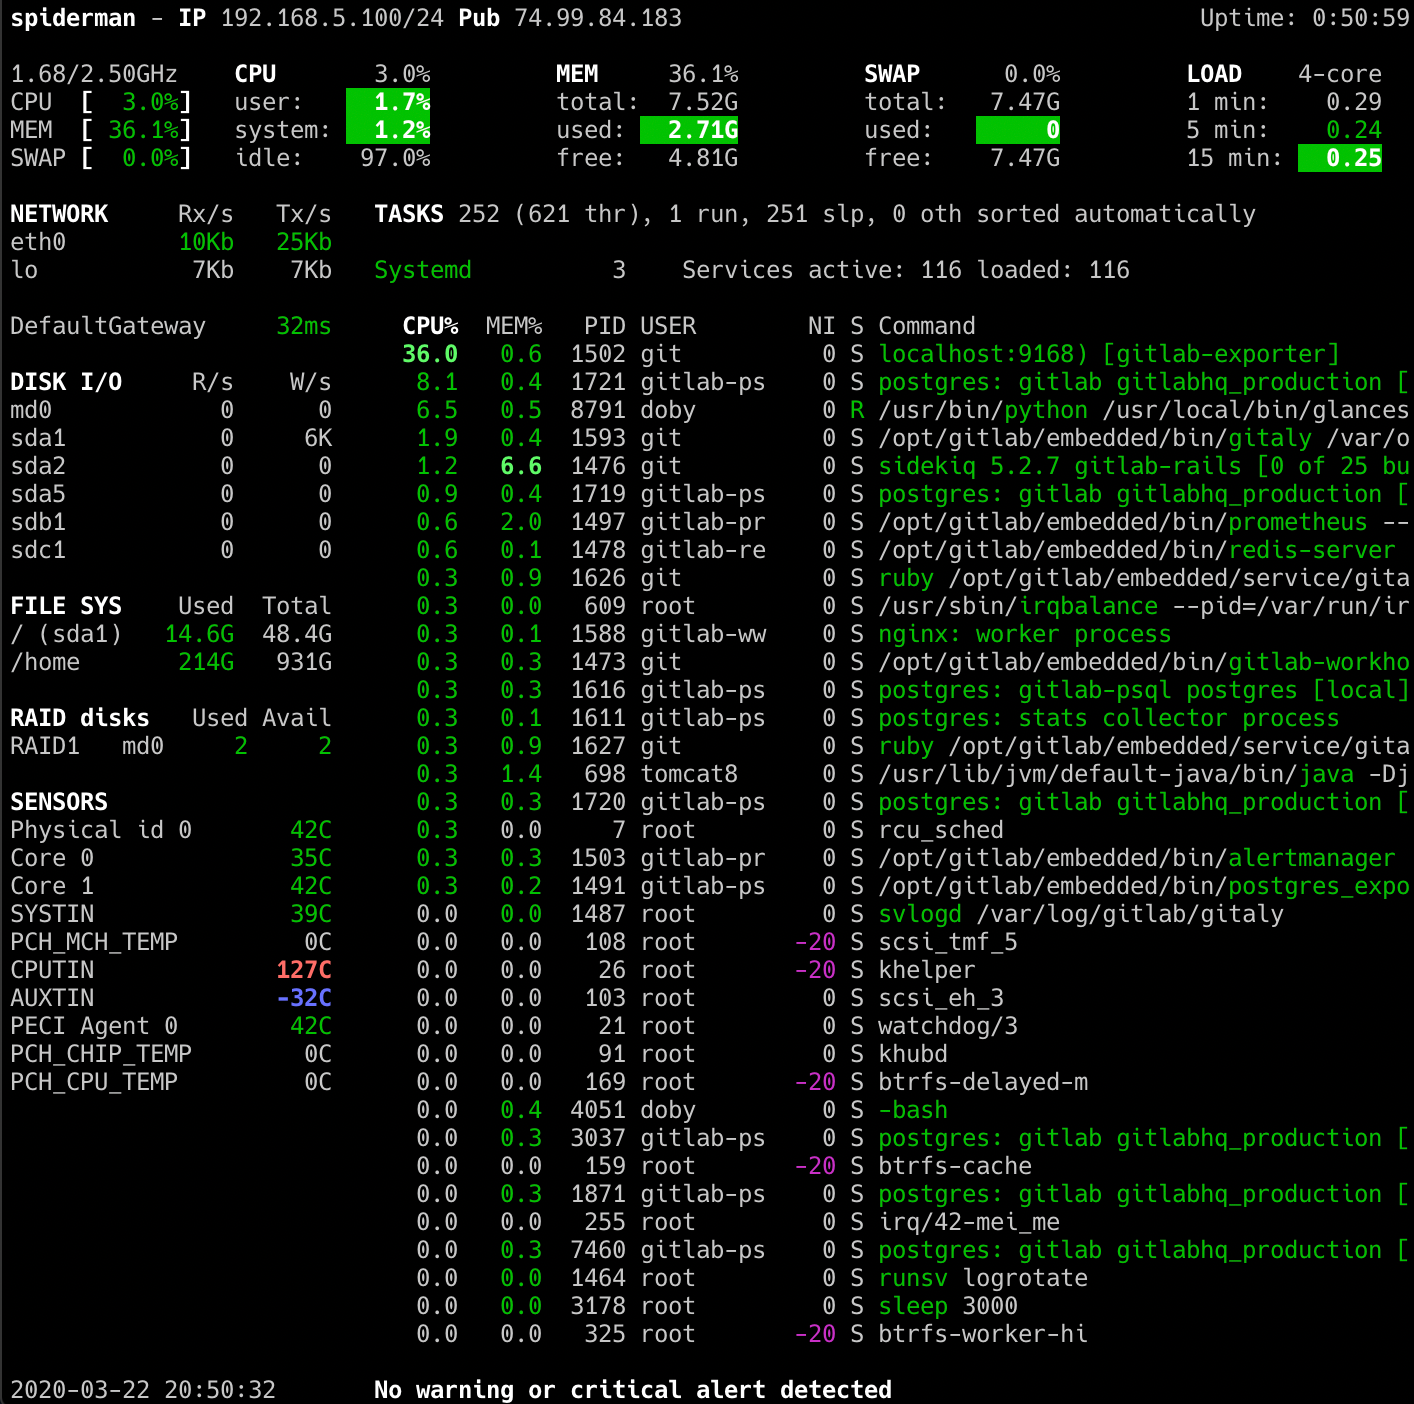
This lead me to look into terminal based monitors and I decided to try glances. It is written in python and has a quick pip based install. Within moments of starting it up I determined that the default settings captured exactly what I needed to know on a single screen. It also puts nearly no load on the system and is actively updated.
Now, I just needed a screen that could be attached to the system, but was as small as possible. I decided to try a monitor designed for security feeds. It comes with a mounting bracket and it's width and height are perfect for the top of my case. The only downside is the image quality and integrated menu, I had to change the configurations a few times before I was able to get an acceptable brightness and contrast. I consider that a minor issue for a monitor of this size and price.
The final problem I encountered was after I had unplugged the keyboard I had been using to work directly on the system. After I turned off the monitor for a while, I had no way of getting the screen to refresh when I turned the monitor back on. I was able to fix this by executing:
setterm -powersave off -blank 0
I added this to my .bashrc so local terminals will set powersave off, and SSH terminals will not error:
if [ $TERM == "linux" ]; then
  setterm -powersave off -blank 0;
fi
Now the monitor displays my dashboard as soon as it is powered up.
I was going to try another terminal based monitor, but was happy with glances so I did not. I thought I would mention it here because others may like it better. blessed-contrib allows you to build dashboards using ASCII art and JavaScript. If you want a custom terminal based dashboard with visualizations, this looks like a great way to accomplish it.
Bonus! While I was searching for dashboards I came across what looks like an amazing web server monitor GoAccess. It is a real-time web log analyzer and it appears to support all major and a few minor web servers. Check out the live demo to get a feel for what it provides.